



One page. Is the date safe?
Executive reporting and Power BI dashboards built straight on your schedule and cost data. One version of the truth from the field to the boardroom, refreshed every update, readable in a minute.
Why reports go unread.
Forty pages, no answer
Long monthly reports bury the two things leadership actually needs: is the date safe, and is the budget safe.
Three numbers for one question
The schedule says one thing, the cost report another, the board deck a third. Trust drops every time someone notices.
Rebuilt by hand every month
Copying data into slides takes days and invites errors. By the time the report goes out, the data date is already old.
How we build reporting.

- 01
Start with the decisions
We ask leadership what they decide each month, then design every view to answer one of those questions and nothing else.
- 02
Connect the source data
P6 or Microsoft Project exports and cost data from your system feed one Power BI model, so every number traces back to its source.
- 03
Build in layers
An executive page, a project page and an analysis page, all on the same model. Each reader goes as deep as they need.
- 04
Trends, not snapshots
Float, SPI, CPI, contingency and forecast finish over time. One month tells you little. Six months tell you where the job is heading.
- 05
Hand it over
We document the model and train your team, so the reporting keeps running whether or not we do.
What you walk away with.
Scoped to your project. Native files and plain-English outputs that stay yours when we leave.
One page with milestone status, forecast finish, cost at completion and contingency, readable in under a minute.
Critical path, float trend, earned value and change exposure for each project, from the same data model.
Every project in one view, sorted by risk, so leadership knows where to spend its attention this month.
A documented model joining schedule and cost sources, built so your own team can maintain and extend it.
A short written summary beside the dashboard that explains what changed, why, and what is being done about it.
Six buildings, one screen.
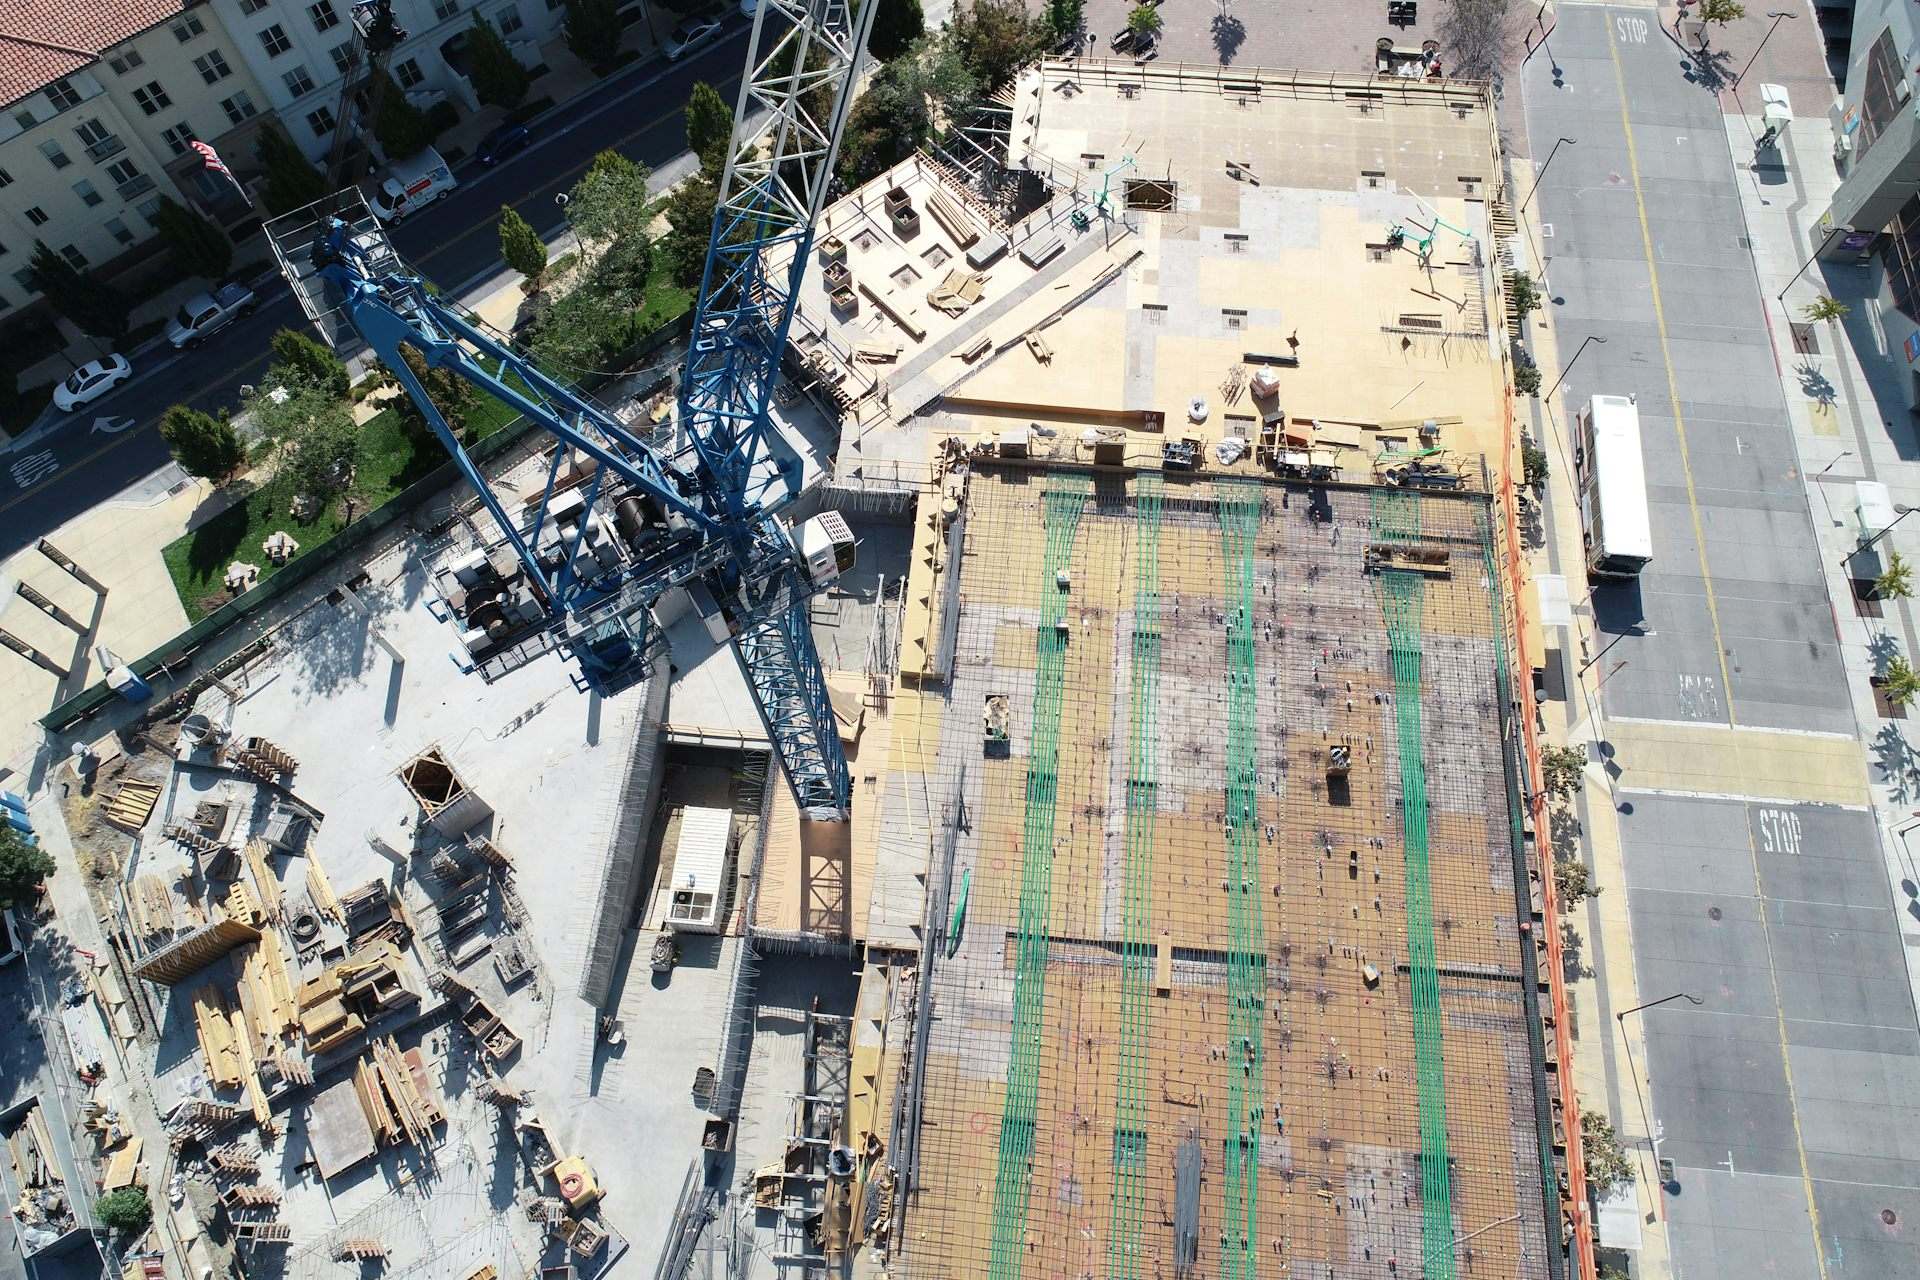
Six powered shell buildings and 240 MW of data halls, delivered as one program over 34 months. A single Power BI view shows every building’s milestones, float and cost side by side, so the owner sees which hall needs attention this week instead of reading six reports.
- $1.65B
- Program value
- 240 MW
- Across 6 buildings
- 34
- Months, program delivery

Straight answers to fair questions.
Do we need Power BI?
It is what we use most, and many organizations already license it. If you run another tool, we will talk through what works.
Can you report on contractor schedules we do not control?
Yes. We build from the native files contractors submit and flag gaps in their data, so they can be fixed in the next update.
Is this useful for one project or only a program?
Both. For a program it is essential. For one large project it saves days of manual reporting every month, and the templates carry over to similar projects at a Program Rate.

Send the schedule. See reality early.
Share the project, the latest schedule and the date you are protecting. A senior project controls lead replies within one business day.